Showing posts with label size metric. Show all posts

Monday, June 11, 2018

Book Series "Increasing Productivity in Software Development"

The PASS Group has been using key figures as the basis for its IT management in more than 10 different application landscapes with more than 500 customers and over 250,000 users for several years and is now publishing its experiences in the form of a series of books. In some areas, the regularly collected key figures demonstrate a 100-fold increase in delivery productivity compared to just a few years ago and they show in which areas further improvements are possible.


Why measure productivity?

IT has already changed almost all areas of life through fundamental innovations. Our future will be dominated by virtualization and smart helpers, i.e. things equipped with intelligence. Software is the stuff of innovation. Software development is a key competence.

Productivity and quality are critical success factors for companies developing software. Only with suitable measuring methods, regular measurements and rapid feedback of the measured values to the team and its management can the effort of planned developments be reliably determined and productivity and quality be continuously improved.

Part 1: "Productivity and Performance Measurement - Measurability and Methods"
Book Series "Increasing Productivity in Software Development"
The first book in the series first explains a practicable definition of productivity for software development and thus shows the conditions under which productivity can be measured at all. It describes the ISO/IEC 14143 standard as an important common basis for all modern function-oriented measurement methods. Some methods are explained in detail and compared with their advantages and disadvantages on the basis of practical examples - tried and tested as well as new ones. The book deals with the automatability of measurements, but also points out their limits, the exceeding of which leads to invalidity measurements due to a strong orientation towards design features instead of application cases.

Another topic is the influence of complexity on the scope to be measured, the different consideration of complexity through different measurement methods and the limits of measurability through function-oriented metrics, for example in systems with above-average algorithmic complexity.

Part 2: "Management Model, Cost Estimation and KPI Improvement"

The second book describes a model based on three key performance indicators (KPIs): Productivity (measured using the measurement methods described in the first book), cost and quality. It explains its cyclical survey, analytical evaluation and indicators, for example by comparing productivity and quality over time or as a result of methodological analyses of the causes of errors, which lead to improvement measures in important areas of influence in software development, so-called key performance areas (KPAs). In order to be able to assess the benefits of the measures in advance, it provides empirical values as well as a method for calculating their effectiveness. The model described is a navigation tool that always shows management in which direction and at what speed it moves with regard to its three KPIs.

The books are available as e-book, paperback and hardcover (in the PASS book shop or at Amazon.com).

Tuesday, September 20, 2016

Direct and indirect Cost Estimation Methods (3)

Indirect Estimations by measuring the Functional Size

A different type of an indirect estimation is determining the functional size (instead of Story Points) and relating it to an empirical value describing which size can be implemented with specific personnel costs (often called productivity or efficiency). The basics for measuring the functional size are defined in the industry standard ISO/IEC 14143. They require the refinement of user stories to use cases.


Sample Use Case Diagram
A use case stands for a system behavior perceptible by an actor from outside of the system boundaries. Actors can be human system users as well as other systems or machines (hardware or software). An example is the use case diagram of a (highly simplified) Internet Booking Engine for flights shown in the accompanying picture. Within the system boundaries (shown as a rectangle with the label "Internet Booking Engine”) use cases are represented by ellipses. They are related to (used by) actors, which in the example below are a traveler and a Computer Reservation System (CRS). Their relation is indicated by lines.

Each use case stands for actions which can be described by base functional components (BFCs) respectively elementary processes. The use case “search flight” could, for example, consist of the following (simplified) elementary processes:

  1. Traveler calls the dialog Flight Search.
  2. Traveler enters the departure date.
  3. Traveler enters the first letters of the destination (name or code).
  4. System looks up for matching airports in the database and displays a list of found items showing names and codes.
  5. Traveler selects a list entry and clicks on the button “Search”.
  6. System sends a message of type “Flight Search Request” including the departure date and airport code to the CRS.
  7. System receives a message of type “Flight Search Response” from the CRS and reads the fields departure time, arrival time, airline, flight number, class, price and currency of all flight records included.
  8. System displays a table showing this information about all received flight records.

With the knowledge of these BFCs or elementary processes many measuring methods can be used to determine the functional size and, with the aid of an empirical value of the own productivity, the expected development costs.

Alternatives:

    Expert Estimations
    Indirect Estimations with Story Points

Book recommendation: "Cost Estimation in Agile Software Development"

Monday, September 19, 2016

Agile Principles are Risk Mitigation Methods

Many risks of commercial software development can be mitigated by the principles of agile development:

Risk: The requirements of the customer are not covered completely. His expectations for example regarding usability have not been fulfilled. 
Measures: The product is developed incrementally, with the cycles being as short as possible. The result of each cycle is operable software, which can be checked by the customer regarding the fulfillment of his expectations. The customer, in particular his business and technical professionals, collaborate closely and intensively with the development team.


Risk: Objectives and requirements of the customer change, before the development is completed, for example as a reaction to unexpected market changes.

Measures: One principle of the Agile Manifesto is: “Welcome changing requirements, even late in development. Agile processes harness change for the customer's competitive advantage.” Thus, agile software development is generally characterized by the willingness to consider new or changed requirements. However, this does not preclude a consensus between the contract parties regarding the commercial effects of such changes. 

Risks: Wrong assessment of the development progress, delays due to communication problems, loss of know-how by staff turnover.
Measures: In agile development processes these risks are mitigated by a high level of teamwork. In short daily team meetings problems can be addressed, the progress can be estimated together, pending tasks can be assigned or even tasks in progress can be re-assigned if it seems reasonable. The avoidance of too rigid role and task assignments makes the team robust toward the loss of individuals. 

Risk: Additional expenses due to quality deficiencies which have been discovered too late. 
Measures: One characteristic of agile development are automated processes for the daily build of an executable system, where an initial code analysis is performed, followed by functionality checks of particular components using unit tests and, if possible, the execution of scripted test cases. 


Risk: Invalid planning of the manpower required to fulfil a development contract within the agreed time.
Measure: This risk can be countered by applying a cost estimation method with accuracy improving with every retrospective. Such methods are described in detail in my book "Cost Estimation in Agile Software Development".

The Book about Cost Estimation in Agile Software Development

Agile software development and a binding agreed delivery date are not mutually exclusive at all. On the contrary, the principles of the Agile Manifesto are well-proven measures to mitigate the typical risks of development projects with binding regulations.

Crucial for the achievement of project goals is a reliable plan which can be created without significant expense and readjusted flexibly in case of changed requirements. Under these conditions, indirect cost estimations on basis of functional size measurements are a proven practice. They require the size of the functional requirements as an input value, determined by precise rules, as well as an empirical value of the own productivity, measured after earlier sprints.

To the Shop
For the determination of functional size, methodological knowledge and expertise is required regarding the selected method, for example Function Point, COSMIC or Data Interaction Point method, along with a sufficient specification of requirements, for example by described use cases and elementary processes. Under these conditions, the resulting value is a valid key figure of the functional requirements’ size. It is independent from the individual performing the estimation. Repeated estimations of the same requirements always result in the same value.

An empirical value of the own productivity, that is the functional size which can be typically implemented by the team with given personnel costs, is required in addi-tion. It can be measured and updated within the scope of regular retrospectives of completed increments, sprints or releases. Thereby, the implemented functional size is set in relation to the arising personnel costs. The functional size is determined by counting – depending on the method – elementary processes or data elements. With an appropriate mapping to structural characteristics of the system, this counting process can be automated. A such counting program, once implemented, can quickly measure the total size of the system and, by comparing the current size with the previous measurement, return the growth of the functional size resulting from the last development process. 

Regularly measured and compared values of productivity and quality - in the simplest case the number of production defects – aid in recognizing any need for action and allow to verify the effectivity of implemented improvement measures.

This book illustrates, how size metrics can be utilised profitably in software development processes oriented towards agile values. It points out differences and restrictions, how the accuracy of cost estimations can be increased with each sprint and examines the feasibility of automated measurements. It is available as eBook, paperback and hardcover at most bookshops, for example at Amazon.com.


Monday, October 6, 2014

The Impact of Complexity

In software development complexity is defined as the effort for understanding a program or algorithm. Consequently the effort for the new or further development of software is not only reliant on the number of user functions, data structures, data elements, etc. (depending of the measuring method) but also of the complexity. However it is necessary to distinguish between different types of complexity.

The Complexity of an Implementation represents the effort for understanding the code and design of an application. It is important for estimating the costs for the maintenance and further development of existing systems. There are multiple metrics measuring different aspects of the complexity inherent in the code: The McCabe metric measures the cyclomatic complexity, the metric of Halstead the textual-lexical complexity, the RfC metric the class complexity, etc. For the cost estimation of a planned new development project this type of complexity has no significance because it accrues from the development process. Furthermore different implementations of the same use case can have different levels of complexity.

The complexity of an implementation has no significance for functional measurement, but the interactional Complexity has. It represents the effort for understanding and implementing the steps of the use case scenarios. The Function Point Analysis derives it from structural parameters as e.g. the number of data element types and record element types related to user functions. The Data Interaction Point Method considers the complexity related to use cases according to the usage of the counted data elements, e.g. for input/output, persistence or read-only access, etc. The COSMIC Method does not consider complexity at all, which is a disadvantage.

All functional size metrics which are conformal to the standard ISO/IEC 14143 ignore the algorithmic Complexity of the business logic lying in processes and functions of the system. They all are based on the assumption that algorithmic complexity has secondary importance towards the functional size. Actually at most systems the algorithmic complexity is limited to input validations, data inquiries, output processing, less complex logical operations and calculations, etc. Usually the number of such functions correlates with the number of interactions with the system's actors. Hence the error due to ignoring the algorithmic complexity is generally negligible. However this does not apply for systems with primarily algorithmic processing, e.g. a route planning program: Its input is a start location and a destination, the output a list of route segments. Every functional size metric would consider only the user interactions and measure a small functional size. Since the development of the undoubtedly highly complex planning algorithms requires high expenditures, the calculation of productivity on basis of the small functional size would indicate a very low productivity compared with other systems - which is incorrect. Conclusion: Functional size measurement is not suitable for systems with an above-average algorithmic complexity.

Monday, July 28, 2014

Economical Measurements (The Limits of Automation)

The functional size of an application should be measured regularly in order to determine the growth and hence the development productivity of each release or increment. Only by comparing cyclic measurements, improving or worsening effects can be identified. Furthermore the organisation gets empirical productivity values which are the key for cost estimations of new development projects (see: Measuring Productivity in Software Development). 

Experience shows that cyclic measurements will be neglected if the accociated effort is too high. Measuring techniques based on counting rules allow a high degree of automation by mapping the objects to be counted to design features of an existing application and implementing the according scripts or programs for counting. The investment in implementing these script or programs quickly pays for itself when repeated measurements do not require anymore manual effort. Possible targets for automated counting are:

  • Dialog models represented by XML or XHTML files as being used by many GUI frameworks
  • XML schemas defining interface or message structures
  • Meta data of a DBMS including information about tables and attributes
When applying automated measurement processes which have a stronger focus on design features than on the use cases of a system there is a risk of inaccurateness if counting objects have been used multiple times by the application design. An example of this is the comparison of two applications A and B, which are different implementations of the same use cases:
  • At application A similiar dialogs have been implemented separately and partially redundant.
  • At application B a generic dialog has been implemented which automatically adapts according to the use case respectively invocation. 
An automated size measurement based on design features will result in a lower value for application B, which is wrong because both applications are implementations of the same use cases. In the worst case this will promote bad development practice (copy & paste) and poor design, if developers try to increase the measured productivity by creating redundant counting objects. Actually this is fatal in several ways, because the reuse of components and services is one of the most important keys to sustainably increase productivity and improve maintainability.

Conclusion: Automated measuring techniques based on design features are necessary to make size measurements practicable at all. However a side effect is the limited comparability of applications with different degrees of reutilization.

Monday, February 3, 2014

The COSMIC Method

COSMIC is a size metric (see Methods for measuring the Size of Software) defined by the standard ISO/IEC 19761. The method is conformal to the standard for Functional Size Measurement (ISO/IEC 14143) and thereby it considers the use cases of a system (similar to the Function Point Analysis).

Objects to be counted by the COSMIC method
COSMIC uses an own definition of actors, the so-called "Functional Users", which can be - additionally to human users and external systems - any hardware or software components sending data to the software to be measured across the system boundaries and thereby triggering a functional process, or receiving and processing data from a functional process of the software. Depending on the direction these data movements are called "entries" or "exits". Additionally, the method counts accesses to data elements which are stored in the database ("read" or "write" operations) and related to the functional processes.

An advantage of the COSMIC method is that it counts data elements directly instead of larger data structures or elementary processes as the Function Point Analysis does (see also Is the Function Point Method still up-to-date?). Another advantage is that regarding the database it considers data movements performed by the functional processes, i.e. read and write operations, and not the static size of the database. These characteristics along with the broad definition of "Functional Users" makes COSMIC suitable for measuring the functional size of real-time systems.

A disadvantage can be that all entries, exits, reads and writes have the same weight and therefore differences in the complexity of their pre- or post-processing can not be considered.      

Monday, July 29, 2013

The PASS Data Interaction Point Method (DIP Method)


The Data Interaction Point method of the PASS Consulting Group is a function-oriented size metric (see: Methods for measuring the Size of Software). It counts data elements which are involved in interactions of the considered system with the actors of its use cases, which can be human users as well as other systems. Complexity is considered by different weights of the counts, e.g. when input elements of a dialog have a higher weight than display elements.

Interactions to be counted by the
Data Interaction Point Method
The basic principles, i.e. the orientation on use cases and the counting of data objects from the external view of the actors are the same on which the Function Point Analysis (FPA) and the COSMIC method are based on. However, a major difference to the FPA is the level of detail for counting. FPA counts e.g. data structures, where the score depends of their number of data element types and record element types defined by open-ended interval scales with only three steps. The DIP and the COSMIC method directly count data elements. While COSMIC does not distinguish score values the DIP method derives them by the usage of data elements, e.g. whether they are for read-only or for read-write access, and thus oriented towards the interactional complexity.

The DIP method is better suited for benchmarking size-related KPIs, e.g. the productivity (see: KPIs for Controlling in Software Maintenance and Development).

Monday, April 29, 2013

Is the Function Point Method still up-to-date?


As shown in my post Methods for measuring the Size of Software, the comparability between KPIs of IT systems of different sizes requires a size measurement method. As well as the effort estimation of a planned development task. 

Since 1979 the best-known method for the analysis of the functional size (as described in the standard ISO/IEC 14143 for Functional Size Measurement) is the Function Point Analysis (FPA). The current standard of FPA is ISO/IEC 20926:2009. Now the method does not need estimations, because it only counts, and all weights are determined. Thus different measurements by different persons always result in the same value, sufficient methodical know-how provided. 
Objects to be counted by the Function Point Analysis

The Function Point Method considers the use cases of a system and counts related user functions / transactions, where data is being sent across the system boundaries (EI = External Input, EO = External Output, EQ = External Inquiry), and structures of internal and external data files (ILF = Internal Logical File, EIF = External Interface File) related to it. A Function Point Analysis according to the original method requires a good understanding of the system’s functionality. Therefore the effort can be high. Today there are approaches for an automated counting (e.g.: http://www.omg.org/spec/AFP/1.0/Beta1/PDF/). These approaches require a good understanding of the code structures and naming conventions related to the user functions and transactions, otherwise structural characteristics will be counted instead of functional. The benefit of such approaches is that counting can be repeated easily after changes of the application have been made and need to be measured.

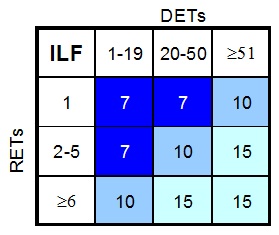
Matrix for the rating of a structure
in an Internal Logical File
A disadvantage of the method is that weights are defined by open-ended interval scales with three steps. As a result, e.g. all files, where the number of data element types (DETs) exceeds 50 and with more than one record element type (RETs) have the same rating – irrespective of the real number of elements.

Most companies, which are measuring the functional size at all, apply the Function Point Method. Unfortunately often by using the approximation method Rapid, which do not consider the complexity at all and replaces the interval scales by average values. Measurements show that counting user functions and data structures without considering the number of related data elements resp. their complexity leads to a restricted comparability of the measured systems. There are other methods complying with ISO/IEC 14143 where this has been improved.


Wednesday, January 23, 2013

Methods for measuring Software Size


Key Performance Indicators (KPIs) are required to check, whether certain aspects of maintenance, development or operation are acceptable, can be improved or even require actions. The according thresholds or baselines can be found by exploring KPIs over a longer period of time - or by benchmarking, i.e. by a comparison of KPIs between different systems or projects.

A good example to explain the dilemma of comparability is the defect rate. Of course the defect rate can be defined as the number of defects (of relevant defect types) in a certain period of time. With such a metric it is not possible to decide whether a system with 20 defects per month is better or possibly worse than another system with 30 defects per month. Another value is required to normalize the defect rate. Similar to the lot size in industrial production we must quantify e.g. the amount or size of the software, because - supposed that the system with its 30 defects per month has the double size of the other system with 20 defects in a month - its number of defects can be rated less critical. The resulting metric is called defect density (see: KPIs for Controlling in Software Maintenance and Development).

There are lots of different approaches to measure the size of software. In the 70s lines of code have been counted. Because this metric depends on the programming language and on individual programming styles it does not meet the requirements for most of the KPIs. A better approach is considering the use cases of a system, as it is described by the standard ISO/IEC 14143 for functional size measurement.

A very popular metric is the function point method, where user functions / transactions and logical files with regard to the use cases are counted. Thus this metric is independent of the code and other technological aspects. However a function point analysis can be time-consuming because it requires a good understanding of the system’s functionality. The weights of the counted transactions and files are based on their complexity and have been defined by interval scales with only three steps. See also my post Is the Function Point Method still up-to-date?

The DIP method (Data Interaction Point Method) of the PASS Consulting Group counts data elements related to the use cases of a system and their interactions with the users and with external systems. In many cases counting of data elements and their equivalences in dialogs and interfaces can be automated. Weights are also based on the complexity, but only depend of the usage of a data element. See also The PASS Data Interaction Point Method (DIP Method).

Of course there can be many other metrics being feasible for normalizing KPIs in IT management, as far as they are 
  • objective (measured values are independent of the measurer), 
  • reliable (repeated measurements show the same results) and 
  • valid (measured values represent the quantity to be measured).